Home / NCERT Solution / NCERT Solution for Class 7 / NCERT Solutions for Class 7 Maths
CBSE Board NCERT Solutions for Class 7th Mathematics Chapter3:Data Handling
Exercise 3.1, Exercise 3.2, Exercise 3.3, Exercise 3.4. Class VII NCERT Solutions
Exercise 3.1
Question 1:
Find the range of heights of any ten students of your class.
Answer:
Let the heights (in cm) of 10 students of our class be
125, 127, 132, 133, 134, 136,138, 141, 144, 146
Highest value among these observations = 146
Lowest value among these observations = 125¨C39C Range = Highest value − Lowest value¨C40C = (146 − 125) cm¨C41C = 21 cm¨C42C ¨C43C ¨C55C 2:¨C44C Organise the following marks in a class assessment, in a tabular form.¨C45C 4, 6, 7, 5, 3, 5, 4, 5, 2, 6, 2, 5, 1, 9, 6, 5, 8, 4, 6, 7¨C46C (i) Which number is the highest?¨C47C (ii) Which number is the lowest?¨C48C (iii) What is the range of the data?¨C49C (iv) Find the arithmetic mean.¨C50C ¨C56C
| Marks | Tally marks | Frequency |
| 1 | I | 1 |
| 2 | II | 2 |
| 3 | I | 1 |
| 4 | III | 3 |
| 7 | II | 2 |
| 8 | I | 1 |
| 9 | I | 1 |
(i) Highest number = 9
(ii) Lowest number = 1
(iii) Range = (9 − 1) = 8
(iv) Sum of all the observations = 4 + 6 + 7 + 5 + 3 + 5 + 4 + 5 + 2 + 6 + 2
- 5 + 1 + 9 + 6 + 5 + 8 + 4 + 6 + 7
= 100
Total number of observations = 20
Question 3:
Find the mean of the first five whole numbers.
Answer:
First five whole numbers are 0, 1, 2, 3, and 4.
Therefore, the mean of first five whole numbers is 2.
Question 4:
A cricketer scores the following runs in eight innings:
58, 76, 40, 35, 46, 45, 0, 100
Find the mean score.
Answer:
Runs scored by the cricketer are 58, 76, 40, 35, 46, 45, 0, and 100.
Therefore, mean score is 50.
Question 5:
Following table shows the points of each player scored in four games:
| Player | Game 1 | Game 2 | Game 3 | Game 4 |
| A | 14 | 16 | 10 | 10 |
| B | 0 | 8 | 6 | 4 |
| C | 8 | 11 | Did not play | 13 |
Now answer the following Questions:
(i) Find the mean to determine A’s average number of points scored per game.
(ii) To find the mean number of points per game for C, would you divide the total points by 3 or by 4? Why?
(iii) B played in all the four games. How would you find the mean?
(iv) Who is the best performer?
Answer:
(ii) To find the mean number of points per game for C, we will divide the total points by 3 because C played 3 games.¨C75C ¨C76C (iv) The best performer will have the greatest average among all. Now we can observe that the average of A is 12.5 which is more than that of B and C. Therefore, A is the best performer among these three.¨C77C ¨C78C ¨C103C 6:¨C79C The marks (out of 100) obtained by a group of students in a science test are 85, 76, 90, 85, 39, 48, 56, 95, 81 and 75. Find the:¨C80C (i) Highest and the lowest marks obtained by the students.¨C81C (ii) Range of the marks obtained.¨C82C (iii) Mean marks obtained by the group.¨C83C ¨C104C¨C84C The marks obtained by the group of students in a science test can be arranged in an ascending order as follows.¨C85C 39, 48, 56, 75, 76, 81, 85, 85, 90, 95¨C86C (i) Highest marks = 95¨C87C Lowest marks = 39¨C88C (ii) Range = 95 − 39¨C89C = 56¨C90C ¨C91C¨C92C¨C93C¨C94C ¨C105C 7:¨C95C The enrolment in a school during six consecutive years was as follow: 1555, 1670, 1750, 2013, 2540, 2820¨C96C Find the mean enrolment of the school for this period.¨C97C ¨C98C¨C99C ¨C106C 8:¨C100C The rainfall (in mm) in a city on 7 days of a certain week was recorded as follows:
| Days Rain | fall (in mm) |
| Monday | 0.0 |
| Tuesday | 12.2 |
| Wednesday | 2.1 |
| Thursday | 0.0 |
| Friday | 20.5 |
| Saturday | 5.5 |
| Sunday | 1.0 |
(i) Find the range of the rainfall in the above data.
(ii) Find the mean rainfall for the week.
(iii) On how many days was the rainfall less than the mean rainfall.
Answer:
(i) Range = (20.5 − 0.0) mm
= 20.5 mm
(iii) For 5 days (i.e., Monday, Wednesday, Thursday, Saturday, Sunday), the rainfall was
less than the average rainfall.¨C119C ¨C120C ¨C254C 9:¨C121C The heights of 10 girls were measured in cm and the results are as follows:¨C122C 135, 150, 139, 128, 151, 132, 146, 149, 143, 141¨C123C (i) What is the height of the tallest girl?¨C124C (ii) What is the height of the shortest girl?¨C125C (iii) What is the range of the data?¨C126C (iv) What is the mean height of the girls?¨C127C (v) How many girls have heights more than the mean height.¨C128C ¨C255C¨C129C Arranging the heights of 10 girls in an ascending order,¨C130C 128, 132, 135, 139, 141, 143, 146, 149, 150, 151¨C131C (i) Height of the tallest girl = 151 cm¨C132C (ii) Height of the shortest girl = 128 cm¨C133C (iii) Range = (151 − 128) cm¨C134C = 23 cm¨C135C ¨C136C¨C137C (v) The heights of 5 girls are greater than the mean height (i.e., 141.4 cm) and these heights are 143, 146, 149, 150, and 151 cm.¨C138C ¨C139C ¨C256C¨C140C ¨C141C ¨C257C 1:¨C142C The scores in mathematics test (out of 25) of 15 students is as follows:¨C143C 19, 25, 23, 20, 9, 20, 15, 10, 5, 16, 25, 20, 24, 12, 20¨C144C Find the mode and median of this data. Are they same?¨C145C ¨C258C¨C146C Scores of 15 students in mathematics test are¨C147C 19, 25, 23, 20, 9, 20, 15, 10, 5, 16, 25, 20, 24, 12, 20¨C148C Arranging these scores in an ascending order,¨C149C 5, 9, 10, 12, 15, 16, 19, 20, 20, 20, 20, 23, 24, 25, 25¨C150C Mode of a given data is that value of observation which occurs for the most number of times. Median of a given data is the middle observation when the data is arranged in an ascending or descending order.¨C151C As there are 15 terms in the given data, therefore, the median of this data will be the 8th observation.¨C152C Hence, median = 20¨C153C Also, it can be observed that 20 occurs 4 times (i.e., maximum number of times).¨C154C Therefore, mode of this data = 20¨C155C Yes, both are same.¨C156C ¨C157C ¨C259C 2:¨C158C The run scored in a cricket match by 11 players is as follows:¨C159C 6, 15, 120, 50, 100, 80, 10, 15, 8, 10, 15¨C160C Find the mean, mode and median of this data. Are the three same?¨C161C ¨C260C¨C162C The runs scored by 11 players are¨C163C 6, 15, 120, 50, 100, 80, 10, 15, 8, 10, 15¨C164C Arranging these scores in an ascending order,¨C165C 6, 8, 10, 10, 15, 15, 15, 50, 80, 100, 120¨C166C ¨C167C¨C168C Mode of a given data is that value of observation which occurs for the most number of times and the median of the given data is the middle observation when the data is arranged in an ascending or descending order.¨C169C As there are 11 terms in the given data, therefore, the median of this data will be the 6th observation.¨C170C Median = 15¨C171C Also, it can be observed that 15 occurs 3 times (i.e., maximum number of times).¨C172C Therefore, mode of this data = 15¨C173C No, these three are not same.¨C174C ¨C175C ¨C261C 3:¨C176C The weights (in kg.) of 15 students of a class are:¨C177C 38, 42, 35, 37, 45, 50, 32, 43, 43, 40, 36, 38, 43, 38, 47¨C178C (i) Find the mode and median of this data.¨C179C (ii) Is there more than one mode?¨C180C ¨C262C¨C181C The weights of 15 students are¨C182C 38, 42, 35, 37, 45, 50, 32, 43, 43, 40, 36, 38, 43, 38, 47¨C183C Arranging these weights in ascending order,¨C184C 32, 35, 36, 37, 38, 38, 38, 40, 42, 43, 43, 43, 45, 47, 50¨C185C (i)¨C186C Mode of a given data is that value of observation which occurs for the most number of times and the median of the given data is the middle observation when the data is arranged in an ascending or descending order.¨C187C As there are 15 terms in the given data, therefore, the median of this data will be the 8th observation.¨C188C Hence, median = 40¨C189C Also, it can be observed that 38 and 43 both occur 3 times (i.e., maximum number of times).¨C190C Therefore, mode of this data = 38 and 43¨C191C (ii)¨C192C Yes, there are 2 modes for the given data.¨C193C ¨C194C ¨C263C 4:¨C195C Find the mode and median of the data: 13, 16, 12, 14, 19, 12, 14, 13, 14¨C196C ¨C264C¨C197C The given data is¨C198C 13, 16, 12, 14, 19, 12, 14, 13, 14¨C199C Arranging the given data in an ascending order,¨C200C 12, 12, 13, 13, 14, 14, 14, 16, 19¨C201C Mode of a given data is that value of observation which occurs for the most number of times and the median of the given data is the middle observation when the data is arranged in an ascending or descending order.¨C202C As there are 9 terms in the given data, therefore, the median of this data will be the 5th observation.¨C203C Hence, median = 14¨C204C Also, it can be observed that 14 occurs 3 times (i.e., maximum number of times).¨C205C Therefore, mode of this data = 14¨C206C ¨C207C ¨C265C 5:¨C208C Tell whether the statement is true or false:¨C209C (i) The mode is always one of the numbers in a data.¨C210C (ii) The mean is one of the numbers in a data.¨C211C (iii) The median is always one of the numbers in a data.¨C212C (iv) The data 6, 4, 3, 8, 9, 12, 13, 9 has mean 9.¨C213C ¨C266C¨C214C (i) True¨C215C Mode of a given data is that value of observation which occurs for the most number of times. Therefore, it is one of the observations given in the data.¨C216C (ii) False¨C217C Mean may or may not be one of the numbers in the data.¨C218C (iii) True¨C219C The median of the given data is the middle observation when the data is arranged in an ascending or descending order.¨C220C (iv) False¨C221C The given data is 6, 4, 3, 8, 9, 12, 13, 9¨C222C ¨C223C¨C224C ¨C225C ¨C267C¨C226C ¨C227C ¨C268C 1:¨C228C Use the bar graph (see the given figure) to answer the following ¨C269Cs.¨C229C (a) Which is the most popular pet?¨C230C (b) How many children have dog as a pet?¨C231C ¨C232C¨C233C ¨C270C¨C234C (a) Since the bar representing cats is the tallest, cat is the most popular pet.¨C235C (b) The number of children having dog as a pet are 8.¨C236C ¨C237C ¨C271C 2:¨C238C Read the bar graph (see the given figure) which shows the number of books sold by a bookstore during five consecutive years and answer the ¨C272Cs that follow:¨C239C ¨C240C¨C241C (i) About how many books were sold in 1989? 1990? 1992?¨C242C (ii) In which year were about 475 books sold? About 225 books sold?¨C243C (iii) In which years were fewer than 250 books sold?¨C244C ¨C245C ¨C273C¨C246C (i) In 1989, 175 books were sold. In 1990, 475 books were sold. In 1992, 225 books were sold.¨C247C (ii) From the graph, it can be concluded that 475 books were sold in the year 1990 and 225 books were sold in the year 1992.¨C248C (iii) From the graph, it can be concluded that in the years 1989 and 1992, the number of books sold were less than 250.¨C249C ¨C250C ¨C251C ¨C274C 3:¨C252C Number of children in six different classes are given below. Represent the data on a bar graph.
| Class | Fifth | Sixth | Seventh | Eighth | Ninth | Tenth |
| Number of children | 135 | 120 | 95 | 100 | 90 | 80 |
(a) How would you choose a scale?
(b) Answer the following Questions:
(i) Which class has the maximum number of children? And the minimum?
(ii) Find the ratio of students of class sixth to the students of class eight.
Answer: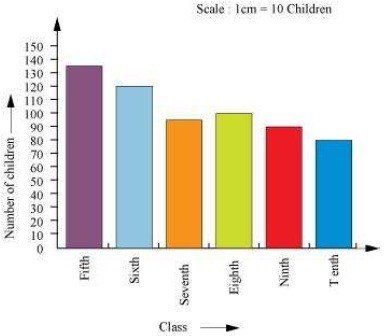
(a) We will choose a scale as 1 unit = 10 children because we can represent a more clear difference between the number of students of class 7th and that of class 9th by this scale.
(b)¨C286C (i) Since the bar representing the number of children for class fifth is the tallest, there are maximum number of children in class fifth. Similarly, since the bar representing the number of children for class tenth is the smallest, there are minimum number of children in class tenth.¨C287C (ii) The number of students in class sixth is 120 and the number of students in class eighth is 100.¨C288C Therefore, the ratio between the number of students of class sixth and the number of¨C289C ¨C290C¨C291C ¨C295C 4:¨C292C The performance of students in 1st Term and 2nd Term is given. Draw a double bar graph choosing appropriate scale and answer the following:
| Subject | English | Hindi | Maths | Science | S. science |
| 1st Term (M.M. 100) | 67 | 72 | 88 | 81 | 73 |
| 2nd Term (M.M. 100) | 70 | 65 | 95 | 85 | 75 |
(i) In which subject, has the child improved his performance the most?
(ii) In which subject is the improvement the least?
(iii) Has the performance gone down in any subject?
Answer:
A double bar graph for the given data is as follows.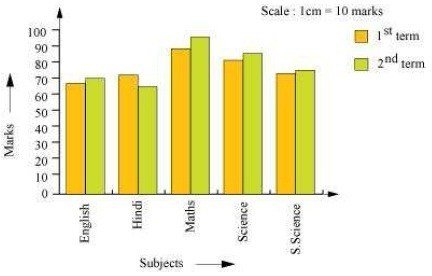
(i) There was a maximum increase in the marks obtained in Maths. Therefore, the child has improved his performance the most in Maths.
(ii) From the graph, it can be concluded that the improvement was the least in S. Science.
(iii) From the graph, it can be observed that the performance in Hindi has gone down.¨C308C ¨C309C ¨C312C 5:¨C310C Consider this data collected from a survey of a colony.
| Favourite sport | Cricket | Basket Ball | Swimming | Hockey | Athletics |
| Watching | 1240 | 470 | 510 | 430 | 250 |
| Participating | 620 | 320 | 320 | 250 | 105 |
(i) Draw a double bar graph choosing an appropriate scale. What do you infer from the bar graph?
(ii) Which sport is most popular?
(iii) Which is more preferred, watching or participating in sports?
Answer:
(i)A double bar graph for the given data is as follows.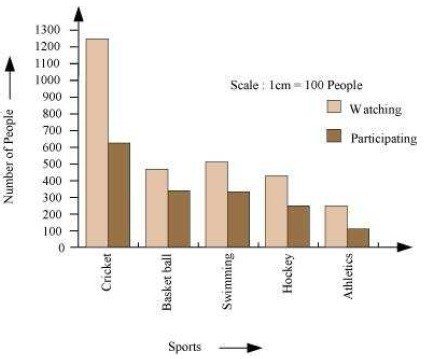
The double bar graph represents the number of people who like watching and participating in different sports. It can be observed that most of the people like watching and participating in cricket while the least number of people like watching and participating in athletics.
(ii) From the bar graph, it can be observed that the bar representing the number of people who like watching and participating in cricket is the tallest among all the bars. Hence, cricket is the most popular sport.
(iii) The bars representing watching sport are longer than the bars representing participating in sport. Hence, watching different types of sports is more preferred than participating in the sports.¨C327C ¨C328C ¨C332C 6:¨C329C Take the data giving the minimum and the maximum temperature of various cities given in the following table:¨C330C Temperatures of the cities as on 20.6.2006
| City | Max. | Min. |
| Ahmedabad | 38ºC | 29ºC |
| Amritsar | 37ºC | 26ºC |
| Banglore | 28ºC | 21ºC |
| Chennai | 36ºC | 27ºC |
| Delhi | 38ºC | 28ºC |
| Jaipur | 39ºC | 29ºC |
| Jammu | 41ºC | 26ºC |
| Mumbai | 32ºC | 27ºC |
Plot a double bar graph using the data and answer the following:
(i) Which city has the largest difference in the minimum and maximum temperature on the given date?
(ii) Which is the hottest city and which is the coldest city?
(iii) Name two cities where maximum temperature of one was less than the minimum temperature of the other.
(iv) Name the city which has the least difference between its minimum and the maximum temperature.
Answer:
A double bar graph for the given data is constructed as follows.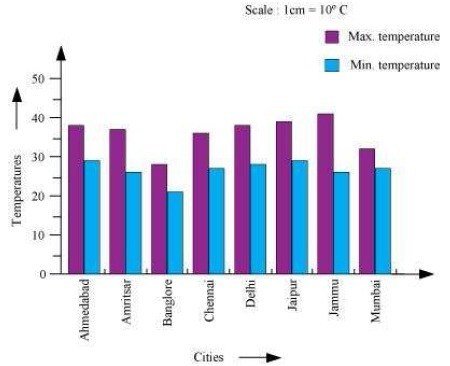
(i) From the graph, it can be concluded that Jammu has the largest difference in its minimum and maximum temperatures on 20.6.2006.¨C345C (ii) From the graph, it can be concluded that Jammu is the hottest city and Bangalore is the coldest city.¨C346C (iii) Bangalore and Jaipur, Bangalore and Ahmedabad¨C347C For Bangalore, the maximum temperature was 28ºC, while minimum temperature of both cities, Ahmedabad and Jaipur, was 29ºC.¨C348C (iv) From the graph, it can be concluded that the city which has the least difference between its minimum and maximum temperatures is Mumbai.¨C349C ¨C350C ¨C392C¨C351C ¨C352C ¨C393C 1:¨C353C Tell whether the following is certain to happen, impossible, can happen but not certain.¨C354C (i) You are older today than yesterday.¨C355C (ii) A tossed coin will land heads up.¨C356C (iii) A die when tossed shall land up with 8 on top.¨C357C (iv) The next traffic light seen will be green.¨C358C (v) Tomorrow will be a cloudy day.¨C359C ¨C394C¨C360C (i) Certain¨C361C (ii) Can happen but not certain¨C362C iii. Impossible as there are only six faces on a dice marked as 1, 2, 3, 4, 5, 6 on it.¨C363C (iv) Can happen but not certain¨C364C (v) Can happen but not certain¨C365C ¨C366C ¨C395C 2:¨C367C There are 6 marbles in a box with numbers from 1 to 6 marked on each of them.¨C368C (i) What is the probability of drawing a marble with number 2?¨C369C (ii) What is the probability of drawing a marble with number 5?¨C370C ¨C396C¨C373C ¨C397C 3:¨C374C A coin is flipped to decide which team starts the game. What is the probability that your team will start?¨C375C ¨C398C¨C376C A coin has two faces − Head and Tail. One team can opt either Head or Tail.¨C377C ¨C378C¨C379C¨C380C¨C381C ¨C382C¨C383C ¨C399C 4:¨C384C A box contains pairs of socks of two colours (black and white). I have picked out a white sock. I pick out one more with my eyes closed. What is the probability that it will make a pair?¨C385C ¨C400C¨C386C It can be observed that while closing the eyes, one can draw either a black sock or a white sock. Therefore, there are two possible cases.
EducationIdol are provided study materials for NCERT Solutions for Class 7 Maths, NCERT solutions for class 7 Maths revision notes, NCERT solutions for class 7 Maths question papers, NCERT solutions for class 7 Maths sample papers, NCERT solutions for class 7 Maths syllabus and NCERT solutions for class 7 Maths important questions. Students can prepare and score well using education idol study materials.